
Medicaid. Legislative Budget Office Staff:
Medicaid is a jointly-funded State/Federal program providing health insurance primarily to low-income parents, non-disabled children, pregnant women, the elderly, and people with disabilities. As a requirement of participation, states must cover certain groups and have the option to cover additional groups. The Health and Human Services Commission (HHSC) is the single state agency responsible for Texas’s Medicaid program, but services are administered by a variety of state agencies.
Basic Federal Requirements. The program must ensure:
- Entitlement: any eligible person may enroll.
- Statewideness: states cannot limit available services to specific geographic locations.
- Comparability: same level of services available to all clients.
- Freedom of Choice of Provider: clients may see any Medicaid health care provider who meets program standards.
The U.S. Secretary of Health and Human Services has broad authority to waive statutory and regulatory provisions, allowing states to test new ways of delivering and paying for services. For example:
- Section 1115 demonstrations do not require statewideness, comparability, or freedom of choice of provider; and
- 1915(c) waivers allow states to provide long-term-care services in home and community-based settings and may be implemented in limited geographic areas with comparability of services with non-waiver enrollees not required.
The Chair asked for examples of 1915(c) waivers. LBB stated that they include CLASS, HCS, TcHML, and others. They all have different eligibility requirements.
Medicaid expenditures are primarily a function of two factors: caseload and cost. As caseloads increase or decrease (due to factors such as population growth, the economy, or policy changes), Medicaid expenditures fluctuate. Medicaid expenditures also fluctuate as a result of cost growth (tied to rate changes, medical inflation, utilization, and acuity), which can be negative or positive.
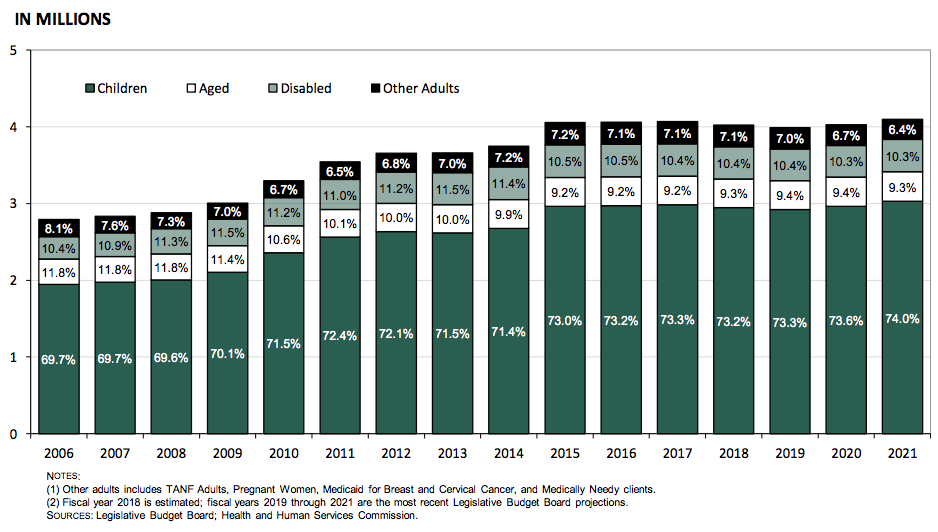
Medicaid Average Monthly Full-Benefit Caseload by Enrollment Group
Fiscal Years 2006 to 2021
Medicaid Average Monthly Full-Benefit Caseload
by Delivery Model Fiscal Years 2006 to 2021
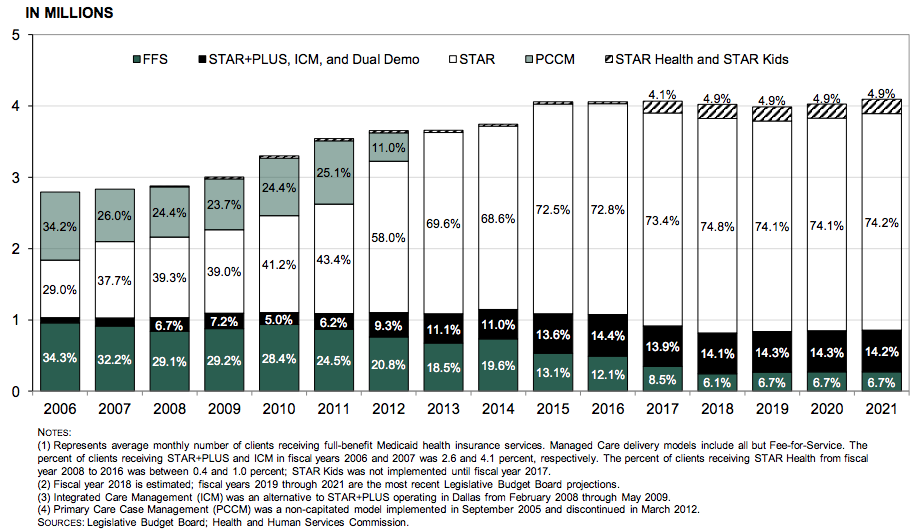
Clients who have received services through a fee for service model have decreased from 34.3 percent in 2006 to a projected 6.7% in FY 2021. The managed care models have increased from 65.7 percent to 93.3 percent over the same period.
Current managed care delivery models include
- STAR: Serves non-disabled children, pregnant women, and certain low-income parents.
- STAR Kids: Serves children, under age 21, with disabilities.
- STAR+PLUS: Serves adults with disabilities, adults over the age of 65, and women enrolled in Medicaid for Breast and Cervical Cancer.
- STAR Health: Serves children in the conservatorship of the Department of Family and Protective Services and certain young adults in foster care or eligible as former foster care children.
- Dual Demonstration (Dual Demo): Serves persons in six counties who are dually eligible for Medicare and Medicaid who were previously enrolled in separate coverage for each program.
Medicaid caseloads more than doubled from fiscal year (FY) 2001 to fiscal year 2015. Caseloads stabilized in FY 2016 to FY 2017 and declined by 1.1 percent in FY 2018, the first decline since FY 2000. Caseloads are projected to decline by an additional 0.9 percent in FY 2019 before returning to low growth in the 2020-21 biennium. Recent events contributing to caseload growth include:
- FY 2001 to FY 2003: Nearly 50 percent growth in children enrolled from FY 2001 to FY 2003 due primarily to Senate Bill 43, Seventy-Seventh Legislature, 2001, which included Medicaid simplification provisions and six months continuous eligibility.
- FY 2008 to FY 2011: Caseloads grew 23 percent from FY 2008 to FY 2011, primarily due to the economic recession, with enrollment of children, people with disabilities, and other adults all growing more than 10 percent.
- FY 2014 to FY 2015: Pursuant to the Affordable Care Act, children ages 6 to 18 with family incomes from 100 to 138 percent of the Federal Poverty Level (FPL) moved from the Children’s Health Insurance Program (CHIP) to Medicaid beginning in early calendar year 2014, adding almost 300,000 children to Medicaid when the transition was complete. Growth in annual average monthly caseload for children is most apparent in FY 2015, which increased more than 10 percent from FY 2014.
- FY 2006 to FY 2021: The population of Texas is projected to grow by 29 percent from calendar year 2006 to 2021.
The primary factors contributing to cost growth include the following:
- Rate Changes: Adjustments to reimbursements to providers.
- Medical Inflation: Growth in costs related to how health care is delivered and what services are available. (Technological and other medical advances and increases in the cost of prescription drugs).
- Utilization: Changes in how many services are accessed.
- Acuity: Relative health of persons enrolled in the program.
The Chair commented on the mischaracterizations pertaining to state expenditures on Medicaid. Specifically, the idea that they are “spending less” on Medicaid. He stated that because they received a more favorable FMAP, fewer state dollars are necessary, but the program as a whole is expanding. We’re able to grow the program “less on the back of GR.”
Find the full report here.
***
The information contained in this publication is the property of Texas Insight. The views expressed in this publication are, unless otherwise stated, those of the author and not those of Texas Insight or its management.