Texas Insight is excited to offer our subscribers a critical resource for providers, legislators, and industry experts: The Market Intelligence Data Workbook.
Contact Texas Insight today to purchase this data-rich tool.
This workbook assembles select public data to help interested parties identify and visualize performance in Texas Medicaid and CHIP. It packages and displays multiyear data sets from disparate public sources and maintains updates as the source data is updated. With this tool, individuals or organizations can better understand Texas Medicaid Managed Care performance across different critical dimensions—market share, spending, quality, and efficiency. Because Texas is continuously moving toward performance-based contracting, understanding relative value is critical.
The best part is— it’s easy to understand and use. As it’s built in an Excel format, this data packaging consists of simple pivot charts, pivot tables and worksheets of comparative data across dimensions of cost, membership, and quality.
To learn more about the workbook, please listen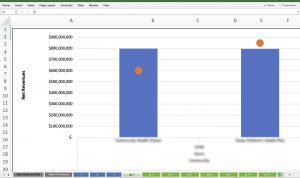 to Texas Insight’s latest Healthcare Talks podcast episode, “Texas Medicaid: The Market Intelligence Data Workbook,” where Texas Medicaid experts Billy Millwee and Matthew Ferrara guide us through the document and the value it provides to operatives in the healthcare space. Find the episode on our website or wherever you get your podcasts.
If you or your organization would like to purchase this tool, give us a call at 512-478-7500, or send an email to info@txinsight.com.
The Market Intelligence Data Workbook FAQs
Managed Care Organizations, Providers, Intermediaries, Investors, Policymakers, Legislators, and the public can utilize this tool to understand Medicaid and CHIP managed care organization performance across numerous key dimensions.
As HHSC moves toward emphasizing high quality, efficient healthcare in Medicaid/CHIP, this tool can be used to identify and compare areas of excellence and where there are opportunities for improvement. It is based on public data and presented in a standardized format across multiple years. It contains data in both searchable data visualizations, as well as summary data “behind” the visualizations.
| CONTENTS |
| 1. General Medicaid Information |
| 2. Managed Care “Value-Based-Payment” Initiatives |
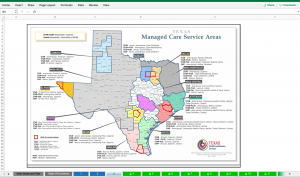
| 3. Managed Care Market Map |
| Searchable Data Visualizations |
| 4. MCO Membership and Net Revenues |
| 5. MCO Market Share Changes over Time |
| 6. MCO Overall Medical Loss Ratios (MLR), Prescription MLR and Net Income Relative to Net Revenue |
| 7. MCO Administrative Expense Relative to Net Revenues |
| 8. MCO Spending Ratios and Case Mix Ratios |
| 9. MCO Premiums by Risk Group |
| 10. MCO Risk Adjusted and Non-Risk Adjusted Potentially Preventable Events (PPE) Data |
| 11. MCO Potentially Preventable Events by Clinical Reason (2019) |
| 12. MCO Inpatient Utilization by Category of Inpatient Stay |
| 13. MCO Outpatient and Emergency Department Utilization |
| 14. MCO Rankings on Select Quality Measures |
| Source Data Tables |
| 15. MCO Alternative Payment Models (2017 and 2018)
31 columns, 299 rows of data |
| 16. Source Data, MCO Membership, Net Revenues, Net Income, MLR, Administrative Costs
12 columns, 412 rows of data |
| 17. Source Data, MCO PPE Risk Adjusted and Non-Risk Adjusted Data
8 columns, 3,466 rows of data |
| 18. Source Data MCO PPE Clinical Reasons (PPE reasons with costs >$75,000 annual)
14 columns, 2,436 rows of data |
| 19. Source Data, MCO Inpatient Utilization by Category
17 columns, 8,479 rows of data |
| 20. Source Data, MCO Premiums
7 columns, 4,320 rows of data |
| 21. Source Data, Spending and Case Mix Ratios
12 columns, 3,050 rows of data |
| 22. Source Data, Outpatient and Emergency Department Utilization Data
17 columns, 1,433 rows of data |
| 23. Source Data, Select Quality Data
18 columns, 13,528 rows of data |
Frequently Asked Questions:
Q: What are the searchable variables in the spreadsheet?
A: The data is organized at the Managed Care Organization (MCO) level, and is searchable by:
- Fiscal or Calendar Year
- Program (STAR, STAR Kids, etc.)
- Managed Care Organization (MCO)
- MCO type (community or national)
- Geographic Service Area
- Risk or Eligibility Group, where applicable
- Type of Potentially Preventable Event (Emergency Department Visit, Hospital Admission, Hospital Readmission)
- Diagnostic Grouping, where applicable
- Inpatient Stay Categorization, where applicable
- Outpatient Visit Type, where applicable
- Quality Measure/sub measure, where applicable
Q: How was it determined which measures and metrics should be included?
A: While there are many metrics considered, the ones included represent the measures most tied to value (cost and quality).
Q: Where does the data come from?
A: It is public data from various Health and Human Services Commission (HHSC) weblinks. The public data sets alone do not tell a comprehensive story until combined with other relevant public performance data in the format we’ve created for this workbook.
Q: How often is the data updated and is it kept current?
A: The data is updated as the source material is updated. Not all the data gets updated at the same frequency, but the overall tool is kept current.
Q: How self-explanatory and/or user-friendly is this document?
A: Within an Excel format, this data packaging consists of simple pivot charts, pivot tables and worksheets of comparative data across dimensions of cost, membership, and quality.
Q: Is there support for interpretation and/or context?
A: Yes, please see contact information for Billy Millwee and Matthew Ferrara below.
Q: How do I access the data?
A: Contact Texas Insight at 512.478.7500 or info@txinsight.com and we will set up an invoice and then send you the document.
Q: How much does it cost?
A: $400 per quarter or $1,500 for the year.
Q: How can I find out more?
A: Listen to Texas Insight’s latest Healthcare Talks podcast episode which is dedicated to the function and value of the Workbook, or contact Billy Millwee or Matthew Ferrara.
Q: Who are Billy Millwee and Matthew Ferrara?
A: Texas Medicaid experts that created and maintain this tool and are collaborating with Texas Insight on its distribution. For questions regarding content, contact M. Ferrara. For any desired consultative services after download, contact B. Millwee.
| Billy Millwee, MHA.
Contact: billy@millweeconsulting.com Billy is currently an independent healthcare consultant. Until August 2012, Billy served as the Texas Health and Human Services Commission (HHSC) Deputy Executive Commissioner and Texas Medicaid Director. In this role he provided operational and programmatic leadership for the Texas Medicaid and CHIP programs and was responsible for a business enterprise that impacts more than 3.5 million lives, affects more than 40,000 providers, and involves the management of almost $30 billion. Billy served in Texas state government for more than 20 years. Previous state government experience includes development of regional trauma systems and development, implementation, and deployment of immunization clinic assessment and program improvement protocols. Since 1998, he has served in a variety of management positions within the Texas Medicaid/CHIP programs, including Director, Early and Periodic Screening, Diagnosis, and Treatment (EPSDT), and Medical Transportation Programs; Director, Program Operations and Policy Development; Director, Managed Care Operations; and Director, Claims Administrator Operations. He served as the Texas Medicaid Director from 2009 – 2012.
He has served as a board member with the National Association of Medicaid Directors (NAMD) and is an alumnus of the Robert Wood Johnson Foundation (RWJF) Medicaid Leadership Fellowship. He has provided invited testimony to the U.S. Congress, House Energy and Commerce Committee on dual-eligibles in Medicaid and the U.S. Senate Finance Committee on prescription drug abuse in Medicaid. Mr. Millwee has authored several articles on Medicaid and healthcare reform. His most recent article appeared in the July/August 2013 edition of the Journal of Ambulatory Care Management and addressed payment reform. Billy was recently selected by the Centers for Medicare & Medicaid Services (CMS) and the Milbank Memorial Fund to co-chair a national committee on innovation acceleration in Medicaid.
He holds a baccalaureate degree in Business Administration from the University of Maryland and a master’s degree in Health Care Administration from Central Michigan University. |
Matthew Ferrara.
Contact: ferrara0619@gmail.com Matt is currently an independent healthcare consultant. Until 2019, Matt served as the Texas Health and Human Services Commission (HHSC) Director of Quality Oversight, which had numerous complex projects within its portfolio, all with the goal of reorienting the Medicaid/CHIP programs toward value-based care.
Matt also served in Texas state government for more than 20 years. Previous positions included oversight of a full-risk managed care model serving Medicaid and non-Medicaid individuals with mental health and substance use disorder needs. He served in numerous capacities— enrollee and provider relations, quality oversight, contract management, budget/finance/rate setting, and director. Prior to his state government experience, Matt was employed by a provider of community-based long-term services and supports, in direct care and executive capacities.
He holds a bachelor’s degree in Social Work from Texas State University, San Marcos Texas.
|